MVSP - 多变量分析软件
MVSP是多变量分析软件,用于执行各种排序和聚类分析。它为从生态学,地质学到社会学和市场研究等领域的数据分析提供了一种简便的方法。 MVSP正在数百个地点使用。使用MVSP进行分析的结果已经发表在期刊上,包括“科学”,“自然”,“生态学”,“石油地质学杂志”和“生物地理学杂志”。
分析完数据后,你可以直接绘制结果。选择要查看的排序轴,并绘制散点图。聚类分析结果的树状图是自动生成的。这些图表可以打印在输出设备上。
MVSP执行多种类型的根分析排序:主成分分析(PCA),主坐标分析(PCO)和对应/分析(CA/DCA)。他执行规范对应分析(CCA),这是生态学研究中流行的技术。您还可以使用23种不同的距离或相似性度量以及7种分组策略执行聚类分析。可以分析的案例和变量的数量受Windows可用内存(RAM和硬盘交换文件)的限制,至多20亿个案例和变量。
桌面
MVSP使用KCS桌面隐喻。在学习数据,统计结果和图表时,您可以在自己面前扩展它们,就像在桌上写字一样。它还有一个笔记本,您可以在其中写下想法和观察结果。尝试新的图形,添加新的数据,检查结果,打印或保存所需的内容。
尝试新图形,添加新数据,细读结果,然后打印或保存所需的图形。退出MVSP时,您可以将窗口的位置和内容保存在桌面上。以后您可以将其还原到相应状态。MVSP使您可以从上次中断的地方接机。可以为不同的项目保存多个桌面。
分析数据后,您可以直接绘制结果。选择要查看的排序轴,将绘制散点图。可以将用于变量的图形和用于CA结果的案例组合在一起。可以生成PCA结果的欧几里德双曲线(带有变量,例如矢量),以及CCA中的环境变量的双曲线。也可以为PCA,PCO和CA/CCA创建卵石图。还可以创建原始变量的散点图,以及汇总变量的箱形图和胡须图。
描述
-
数据矩阵处理:将数据转置,转换(可用的转换包括以10为底的对数,e和2,平方根,Aitchison的数据),转换为比例,标准分数,八度音阶或范围通过地层研究的格式,可以选择行和列删除
-
数据导入和导出:Lotus 1-2-3和Symphony和Cornell生态计划
-
主坐标分析,执行以下选项:使用类型的输入度矩阵,用户定义的值和度
-
主成分分析,具有以下选项:相关或协方差矩阵,居中或非中心分析,用户定义的值,Kaiser和Jolliffe的平均值规划,用户自定义的度水平
-
对应分析,具有以下选择:Hill的细分趋势,分析或倒数平均算法的选择,罕见或常见分类群的加权和缩放,用户定义的值和度水平。
-
欧几里得,标准欧几里德,余弦(或标准欧几里得),曼哈顿度量,堪培拉度量,和弦,卡方,平均和平均字符差距等十九种不同的度和距离度量。 Pearson乘积矩相关和Spearman秩相关系数;度和高尔的系数; Sorensen、Jaccard的匹配,Yule和Nei的二进制系数。
-
聚类分析,具有以下选择:七种策略(UPGMA,WPGMA,中位数,质心),约束聚类,其中保持输入顺序(例如地层研究),随机输入顺序,积分树状图生产。-独立的应用程序允许数据矩阵按树状图的顺序排序;允许在数据中看到模式。
-
多样性指数有以下选项:辛普森指数,香农指数或布里渊指数,还可以计算出对数基数,均匀度和物种数量的选择。

MVSP是可以执行一些数值分析的程序。这些可以用于科学领域。它还可以计算几种分析法则,包括主坐标,对应/去趋势对应分析和主坐标。该程序可以执行具有不同距离和相似性度量以及聚类策略的聚类分析。借助其双重聚类选项,用户可以在一个步骤中生成大小写和变量的某些树状图。原始数据矩阵可以按照与它们的树状图的顺序排列。可以执行约束聚类,因此可以保持原始输入数据的顺序。
但是,可以分析的大小写和变量的数量限于Windows计算机(硬盘和RAM交换文件)上的内存量。MVSP提供了几种数据处理功能。这些功能包括转换,合并数据文件以及转换为不同类型的格式。数据也可以导出多种格式。
功能:
易于使用,具有现代Windows界面(可配置工具栏,上下文菜单,菜单结构)
用于定义的选项会自动保存以备将来使用
可保存的桌面;您可以将当前分析会话中的结果,图形和注释保存到磁盘,然后稍后将其还原以恢复到上次中断的位置。
无限数量的变量和大小写(受可用的Windows内存(包括RAM和硬盘交换文件))。
数据矩阵处理:
内置类似电子表格的数据编辑器;包括多类撤消功能,行和列的删除和插入。
矩阵转置
数据转换,使用对数以10,e和2为平方根,对数数据的Aitchison对数和标准化。可以选择各个变量进行转换。
转换成地层范围格式
可以将个案分配给预先指定的组;然后将这些显示在结果和图形上
将多个数据文件合并为一个
数据导入和导出;Lotus 1-2-3和Symphony,Excel,Quattro,xBase,Paradox,SIMSTAT,纯文本和Cornell生态程序
通过使用“导入预览”对话框,简化了导入过程;使您可以预览导入的数据并更改选项以获得成功
分析:
易于选择要纳入分析的变量和案例;无需修改原始数据
主成分分析,具有以下选项:相关性或协方差矩阵,居中或无中心分析,用户定义的要提取的轴数,包括平均值的Kaiser和Jolloffe规则。
使用以下选项执行的主坐标分析:使用类型的输入性矩阵,用户定义的轴数来提取和精度。
对应分析,具有以下选项:Hill的分段分解,选择循环Jacobi或倒数平均算法,对或常见分类单元进行加权并缩放,用户定义的要提取的轴数和精度,用于表示案例的替代缩放比例的选择与变量。
规范对应分析(Canonical Correspondence Analysis)是在生态学研究中流行的一种技术,用于将环境变量纳入物种分布的排序。
图形:
原始数据中变量的散点图(2-d和3-d)
原始数据的箱形图和晶须图
PCA,PCO和CA/CCA的散点图(2-d和3-d)
CA/CCA结果的联合图(变量和案例的散点图)
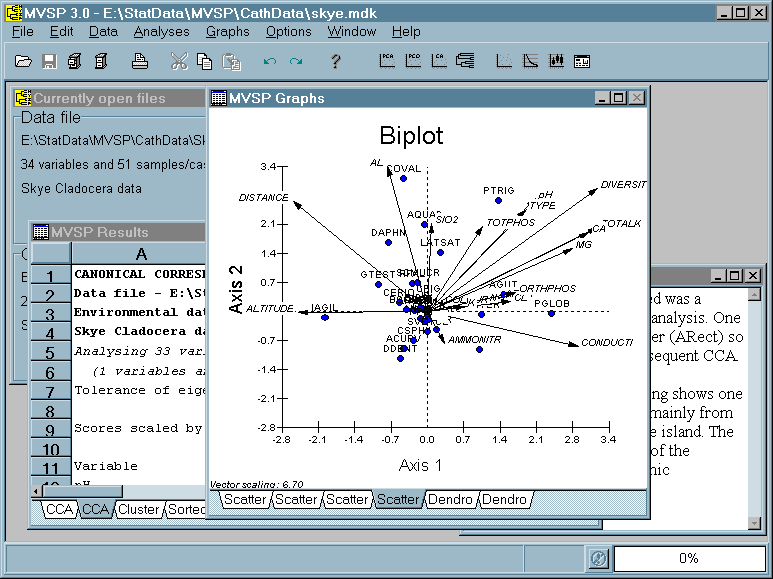
欧几里德双曲线(以变量绘制为矢量的情况的散点图)的PCA结果
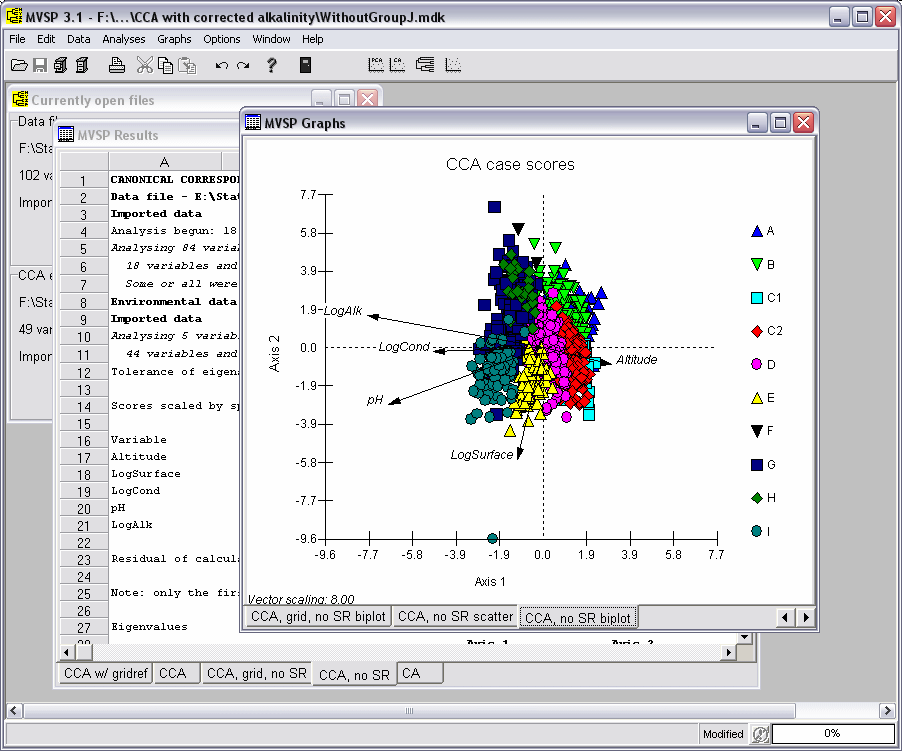
CCA双曲线,环境变量为矢量,或名义变量为质心
PCA,PCO和CA/CCA结果的值的Scree图
散点图上的点可以通过单击点来识别,也可以将标签应用于点
将案例分配给组时,散点图为组显示不同的符号,用户可以使用自已定义的符号和颜色
聚类结果的树状图(基于图形和基于文本)
放大图表以更仔细的查看区域
可定制;可以修改字体,标题,颜色,背景样式,轴缩放比例和位置,散点图符号的类型和颜色。保存位置以供将来使用
将图形另存为BMP或WMF文件,或复制到Windows剪贴板以传输到其他程序
英文简介:
MVSP is an inexpensive yet powerful multivariate analysis program for PC compatibles that performs a variety of ordination and cluster analyses. It provides an easy means of analyzing your data in fields ranging from ecology and geology to sociology and market research. MVSP is in use at hundreds of sites in over 50 countries. The results of analyses using MVSP have been published in numerous journals, including Science, Nature, Ecology, Journal of Petroleum Geology, and Journal of Biogeography.
Once your data have been analyzed you can plot results directly. Select the ordination axes you want to see and scattergrams will be drawn. Dendrograms of cluster analysis results are produced automatically. These graphs can then be printed on a variety of output devices.
DESCRIPTION
-
Data matrix manipulation: data may be transposed, transformed (transformations available include logarithms to base 10, e, and 2, square root, and Aitchison’s logratio for percentage data), converted to percentages, proportions, standard scores, octave class scale, or range through format for stratigraphic studies, and rows and columns may be selected for deletion
-
Data import and export; Lotus 1-2-3 and Symphony and Cornell Ecology Programs
-
Principal Coordinates Analysis, performed with the following options: use any type of input similarity matrix, user defined minimum eigenvalues and accuracy level
-
Principal Components Analysis, with the following options: correlation or covariance matrix, centered or uncentered analysis, user defined minimum eigenvalues, including Kaiser’s and Jolliffe’s rules for average eigenvalues, user defined accuracy level.
-
Correspondence Analysis, with these options: Hill’s detrending by segments, choice of eigenanalysis or reciprocal averaging algorithm, weighting of rare or common taxa and scaling to percentages, user defined minimum eigenvalues and accuracy level.
-
Nineteen different similarity and distance measures, including Euclidean, squared Euclidean, standardized Euclidean, cosine theta (or normalized Euclidean), Manhattan metric, Canberra metric, chord, chi-square, average, and mean character difference distances; Pearson product moment correlation and Spearman rank order correlation coefficients; percent similarity and Gower’s general similarity coefficient; Sorensen’s, Jaccard’s, simple matching, Yule’s and Nei’s binary coefficients.
-
Cluster analysis, with the following options: seven strategies (UPGMA, WPGMA, median, centroid, nearest and farthest neighbor, and minimum variance), constrained clustering in which the input order is maintained (e.g. stratigraphic studies), randomized input order, integral dendrogram production. Separate utility program allows data matrices to be sorted in the order of the dendrograms; allows patterns to be seen in the data.
-
Diversity indices, with the following options: Simpson’s, Shannon’s, or Brillouin’s indices, choice of log base, evenness and number of species can also be calculated.
Other Features
MVSP offers various data manipulation features, such as transformation, merging of two or more data files, and conversion to formats such as range-through. Data can be imported from and exported to a variety of formats, including Lotus 1-2-3, Excel, Quattro, xBase, Paradox, Cornell Ecology Program format and various plain text files.
Individual data cases can be assigned to groups. The group names are then printed on output and dendrograms, and the groups are depicted on scatterplots as different symbols. A fully customizable toolbar is available. Also, the data editor and other windows have multiple level undo, letting you reverse any changes you have made in the current session.
Features of MVSP
Easy to use, with modern Windows interface(configurable toolbar, context menus, simple menu structure).
Numerous user-defined options that are automatically saved for future use.
Saveble desktop;you can save all the results, graphs and notes of the current analysis session to disk, then restore them later to resume where you left off
Unlimited number of variables and cases(restricted only by available Windows memory, including both RAM and hard disk swap file).
Data matrix manipulation:
-
Built in spreadsheet-like data editor; includes full multievel undo capabilities, row and column deletion and insertion
-
Transposition of matrix
-
Transformation of data, using logarithms to base 10,e, and 2, square root, Aitchison's logratio for percentage data, and standardization.
-
Individual variables may be selected for transformation
-
Conversion to range through format for stratigraphic studies
-
Merging of several data files into one
-
Data import and export; Lotus 1-2-3 and Symphony, Excel, Quattro, xBase, Paradox, SIMSTAT, plain text and Cornell Ecology Programs.
-
Import process eased by the use of the Import Preview dialog;lets you preview the imported data and change options to ensure successful results
Analyses:
-
Easy selection of variables and cases to include in analysis; no need to modify original data
-
Principal Components Analysis, with the following options:correlation or covariance matrix, centred or uncentred analysis, user defined number of axes to extract, including Kaiser's and Jolliffe's rules for average eigenvalues, user defined number of axes to extract and accuracy level.
-
Correspondence Analysis, with these options:Hill's detrending by segments, choice of cyclic Jacbi or reciprocal averaging algorithm, weighting of rare of common taxa and scaling to percentages, user defined number of axes to extract and accuracy level, choice of alternative scalings for representing cases vs. variables.
-
Canonical Corespondence Analysis, a technique highly popular in ecological studies for incorporating environmental variables into an ordination of species distribuyions.
-
Twenty three different similarity and distance measures, including Euclidean, squared Euclidean, standardized Euclidean, cosine theta(or normalized Euclidean), Manhattan metric, Canberra metric, Bray Curtis, chord, aquared chord, chi-square and mean character difference distances; Pearson product moment correlation and Spearman rank order correlation coefficients; Percent similarity, modified, Morisita's similarity and Gower's general similarity coeffcient; Srensen's, Jaccard's simple matching, Yule's Nei's and Baroni-Urbani-Buser's binary coefficients.
-
Cluster analysis, with the following options: seven strategies(UPGMA, WPGMA,median, centroid mearest and fathest neighbour, and minimum variance), constrained clustering in which the input order is maintained(e.g. stratigraphic studies), randomized input order, integral dendrogram production. Dual clustering of both variables and cases with a sorted data matrix being produced; allows patterns to be seen in the data.
-
Diversity incices, with the following options:Simpson's Shannon's or Brillouin;s indices, choice of log base, evenness and number of species also calculated.
Graphcs:
-
Scatterplots(2-d and 3-d) of variables in raw data
-
Box and whisker plots of raw data
-
Scatterplots(2-d and 3-d) of PCA, PCO and CA/CCA results
-
Joint plots(scatterplot of cases with variables plotted as vectors) of PCA results
-
CCA biplots, with environmental variables ad vectors or, for nominal variables, as centroids
-
Scree plots of eigenvalues from PCA, PCO and CA/CCA results
-
Dendrograms of clustering results (both graphic and text-based)
-
Points on scatterplot can be identified by clicking on point. Also can have labels applied to all points
-
Zoom in on graphs to views specific areas more closely
-
Fully customizable: can modify, titles, coloues, background style, axis scalling and placement, type and colour of scatterplot symbol. All settings saved for future use
-
Save graphs as BMP or WMF files, or copy to windows clipboard for transfer to other programs.

- 2026-01-20
- 2026-01-16
- 2026-01-12
- 2026-01-12
- 2026-01-09
- 2026-01-05
- 2026-02-05
- 2026-02-05
- 2026-01-28
- 2026-01-26
- 2026-01-26
- 2026-01-16


