SimLipid - 脂质组学分析解决方案
SimLipid是一种高通量脂质鉴定和定量软件。它可以处理来自数百个LC-MS和MS/MS实验运行的原始数据,用于LC峰检测、峰拾取、分子特征发现和保留时间校准。原始数据或峰列表(包含已处理的LC-MS数据的数据集)可以进行MS和MS/MS数据库搜索以进行结构解析,即使在批处理的模式下也是如此。专有的评分机制可区分每次MS/MS扫描的等压候选结构。
SimLipid特点:
强的脂质结构数据库
SimLipld数据库是一个可扩展的关系数据库,包含9种脂质类别,即Carnitines, Fatty acyls, Glycerolipids, Glycerophospholipids, Polyketides, Prenols, Saccharolipids, Sphingolipids和Sterols。该数据库存储了40,312种脂质和15,08,293种结构特定的MS/MS特征离子。除此之外,该数据库还存储了5227个前体扫描和中性损失扫描三重四极杆质谱法的转换,分别对应于glycerophospholipids, glycerolipids, 和sphingolipids的1,179、393和221个特有的脂肪酰基。
用户可以创建自定义数据库*来存储精选脂质以及保留时间和漂移时间。创建自定义数据库后,可以使用保留时间和漂移时间容差作为初始搜索谓词来执行用于脂质结构鉴定的MS和MS/MS数据库搜索。此功能便于用户创建LC-MS或Ion Mobility-MS模板;从而使他们能够利用LC-MS和IMS技术进行研究。
其他数据库链接包括Kyoto Encyclopedia of Genes and Genomes (KEGG)、人类代谢组数据库(HMDB)、生物感兴趣的化学实体(CEBI)、PubChem物质数据库、LIPIDBANK和LIPIDAT。数据库不断更新。
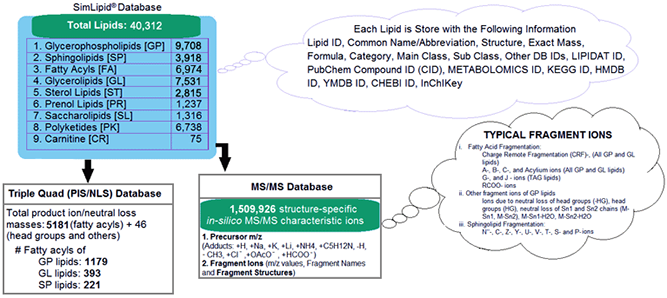
图1:SimLipid数据库的示意图
请注意:* 该功能在程序的企业版中可用
项目管理和数据可视化
SimLipid提供项目管理,将脂质分析结果与输入配置文件和搜索参数相关联。您可以创建任意数量的项目。您还可以批量导入数百个原始数据文件。来自实验性MS运行的原始数据:总离子色谱图、已鉴定的脂质、MS或MS/MS光谱,以及它们相应的数据库信息都显示在一个工作台中。

图 2:SimLipid软件的典型图形用户界面:一个单一的工作台,使您能够可视化LC-MS、ESI-MS、MALDI-MS实验扫描的原始数据、执行数据库搜索后的结果以及已识别的相应信息脂质。
SimLipid提供以下附加功能:
1. 对应于指定保留时间窗口和/或前体m/z范围的平均MS和MS/MS扫描。
2. 根据支持的文件格式的前体离子 m/z、电荷状态、保留时间、强度和漂移时间对加载的数据集进行排序。
3. 识别脂质的扫描/光谱用颜色编码,旁边显示已识别脂质的名称/缩写/分子式。
4. 查看目标m/z的提取离子色谱图。
高通量MS脂质搜索
SimLipid通过针对SimLipid数据库中Carnitines, Fatty acyls, Glycerolipids, Glycerophospholipids, Polyketides, Prenols, Saccharolipids, Sphingolipids和Sterols的已知脂质结构搜索脂质前体离子,从多个MS峰列表数据中实现高通量脂质分析。用户可以对误差容限小于或等于50ppm或2000milliDalton(mDa)的高分辨率数据执行MS脂质搜索。SimLipid支持正离子模式下的[M+H]、[M+NH4]、[M+Na]、[M+C5H12N]、[M+Li]离子和[M-H]、[M+AcO]、[M +Cl]、[M-CH3]、[M+OAcO]和[M+HCOO]在负离子模式下。用户还可以从MS脂质谱触发产物离子数据分析。可以使用候选脂质种类的产物离子数据来验证对应于前体m/z的轮廓脂质。用户可以从预定义的m/z值和相应离子种类列表中导入已包含在高通量搜索中的前体m/z值的离子种类。这有助于在可变离子模式和不同的加合物中进行MS/MS搜索。有多个选项可用于根据保留时间、前体m/z和强度选择要包含在批次运行中的MS和MS/MS配置文件。
使用MS/MS和MSE数据进行高通量脂质结构解析
SimLipid支持使用来自Carnitines, Fatty acyls, Glycerolipids, Glycerophospholipids, Polyketides, Prenols, Saccharolipids, Sphingolipids和Sterols的MS/MS和MSE光谱的前体和产物离子m/z数据对脂质进行结构解析。已识别的脂质根据一种排序算法进行评分,该算法表明理论脂质与实验数据的相对接近程度。可以分析具有0.001-50ppm和0.1到2,000milliDalton (mDa) 之间误差容限的高分辨率准确质量数据。
多重前体离子扫描(PIS)和中性损失扫描(NLS)三重四极杆质谱法基于脂质分析和定量的方法
来自多个PIS/NLS的数据可以使用原生文件格式或标准格式导入SimLipid软件。用户可以通过根据生物/技术复制对数据文件进行分类,在SimLipid中对实验设计进行建模。基于target fatty acyls/head group fragment ions或其中性损失的脂质鉴定以批处理模式进行。
SimLipid能够量化对应于MS光谱上观察到的峰的脂质。量化是通过根据所选内标的观察强度对强度值进行归一化来完成的。该程序有助于将内源性/外源性脂质规范为内部标准。为了能够从低分辨率光谱中定量脂质,SimLipid校正了同位素重叠的强度。这有助于准确量化生物混合物中的脂质。量化数据以及其他信息(例如峰m/z、分子式、不同样品中的校正、未校正和归一化强度)可以导出为与电子表格兼容的.csv和.xls格式。
LC MS和LC-MS/MS高通量数据处理
SimLipid处理LC-MS和MS/MS数据以进行峰检测、平滑、色谱解卷积、峰去同位素和分子特征查找。该程序将检测到的峰值m/z值与相应的MS/MS光谱对齐,从而能够使用来自MS和MS/MS数据的前体和产物离子数据识别脂质结构。

图 3:使用MPIS/NLS QqQ MS方法数据的SimLipid软件脂质分析和定量工作流程示意图
SimLipid还有助于对从不同生物样品中鉴定的脂质进行比较和定量分析。使用RANSAC技术,根据保留时间、m/z值、观察到的强度和电荷状态的一致性,对从不同峰列表中检测到的峰进行对齐。至多可以对齐200个峰值列表,结果可以导出为HTML、CSV和MS Excel格式。
SimLipid软件提供LC-MS峰列表的单一工作台视图;在实验性LC-MS运行中确定的脂质列表;在特定保留时间鉴定的脂质结构;数据库中已识别脂质的相关信息;和总离子色谱图,在已识别脂质的保留时间处带有垂直条。
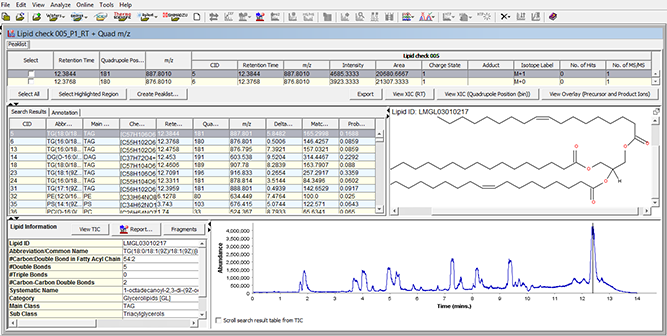
图 4:SimLipid软件的典型图形用户界面:LC-MS峰列表的单一工作台视图、在保留时间点识别的脂质列表、在选定保留时间点的脂质结构以及带有垂直线的样品色谱图表示显示的脂质结构的保留时间点。
鉴定脂质的质谱注释
SimLipid使用脂质注释质谱,并为MS、MS/MS以及MSE识别碎片离子。这有助于通过突出显示与产品数据库中的理论脂质结构相匹配的实验m/z值来解释质谱。
注释的质谱可以调整/重新调整大小以适合页面或基于感兴趣的区域。用户可以使用鼠标光标或通过指定m/z范围来放大/缩小到特定的绘图位置。此外,用户可以将到注释的光谱导出为可包含MS PowerPoint中的图像(PNG和JPEG格式),从而促进研究小组之间的信息共享。
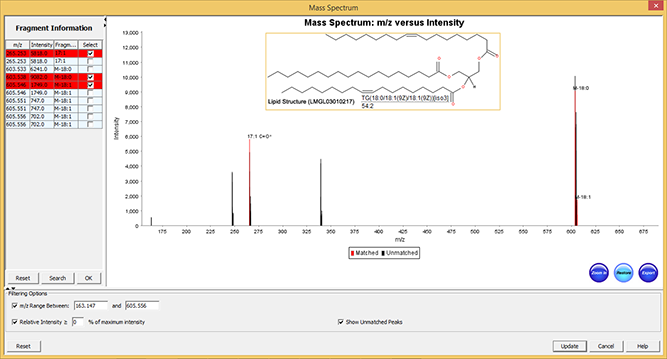
图 5:SimLipid软件的典型图形用户界面:已识别脂质TG(56:3) 的注释MS/MS光谱。光谱中观察到的两个强峰分别对应于结构的特有脂肪酸链的特征离子18:1和20:1。
生成报告
分析质谱数据后,用户可以从50,000个MS和MS/MS配置文件中生成HTML、csv和MS Excel格式的目标导向报告。用户可以将SimLipid设置为在执行分析后自动启动报告。可以生成的报告用于:
-
Profiled MS Spectra:可以为生物标志物研究生成不同生物样品中存在的异质脂质丰度的比较分析。
-
MS和MS/MS数据:报告显示与在MS搜索中通常遇到的前体m/z值相对应的误报,以及在子离子数据分析期间识别的脂质的概率分数。这样的报告是通过结合MS脂质谱及其互补的MS/MS或MSE脂质谱生成的。
-
多个数据集:一份报告,其中包含对从不同离子模式和加合物中获得的不同MS或MS/MS光谱分析的脂质进行比较分析。
-
Retention Time:该报告使用户能够通过根据保留时间对齐MS/MS曲线来研究在可变离子模式下采集的MS/MS光谱中观察到的碎片离子。这提供了一个工作流程解决方案,用于识别属于GP、SP、GL等类别的未知脂质的结构,其中对应于脂肪酸链的诊断离子在阴性光谱中被观察到,而对应于head group的诊断离子在阳性离子光谱中被观察到。
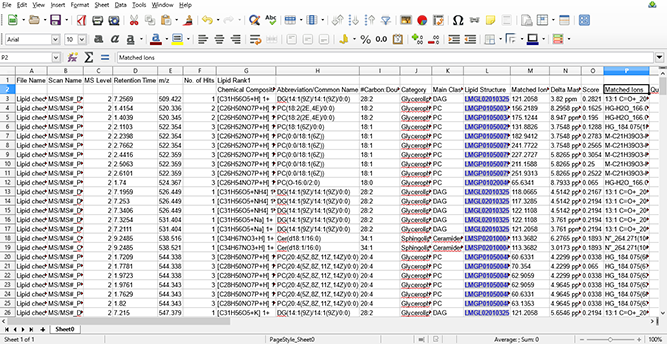
图 6:使用导出到MS excel文件的MS/MS数据识别的脂质。
数据库搜索
您还可以通过脂质缩写/通用名称、质量、化学成分或脂质ID搜索感兴趣的脂质结构。
系统要求:
| 对于Windows | 需要 | 推荐 |
| CPU | Core i3 | 更高 |
| 内存 | 8GB | 16GB |
| 硬盘空间 | 25GB可用硬盘 | 更高 |
| 屏幕分辨率 | 1024×786 | >1024×768 |
Windows支持的平台:Vista/Windows 7/Windows 8/Windows 10
【英文介绍】
SimLipid is a high throughput lipid identification and quantification software. It can process raw data from hundreds of LC-MS and MS/MS experimental runs for LC-peak detection, peak-picking, molecular feature finding and retention time alignment. The raw data or peaklists – dataset containing processed LC-MS data – can be subjected to MS and MS/MS database search for structural elucidation, even in batch mode. A proprietary scoring mechanism distinguishes isobaric candidate structures for each MS/MS scan.
SimLipid Features
Robust Lipid Structure Database
SimLipid database is a scalable relational database containing 9 lipid categories namely, Carnitines, Fatty acyls, Glycerolipids, Glycerophospholipids, Polyketides, Prenols, Saccharolipids, Sphingolipids and Sterols. The database stores 40,312 lipids, and 1,508,293 structure-specific in-silico MS/MS characteristic ions. Besides this, the database also stores 5227 transitions of precursor ion scan and neutral loss scan triple quadrupole mass spectrometry methods corresponding to 1,179, 393, and 221 unique fatty acyls from glycerophospholipids, glycerolipids, and sphingolipids respectively.
User can create custom databases* to store curated lipids along with retention times, and drift time. Once a custom database is created, MS, and MS/MS database search for structural identification of lipids can be performed using retention time, and drift time tolerances as initial search predicates. This functionality facilitates users to create LC-MS or LC-Ion Mobility-MS templates; thereby enabling them to exploit the state of the art LC-MS and IMS technologies for their research.
Other database links include Kyoto Encyclopedia of Genes and Genomes (KEGG), Human Metabolome Database (HMDB), Chemical Entities of Biological Interest (CEBI), PubChem Substance database, LIPIDBANK, and LIPIDAT. The database is continuously being updated.
Project Management and Data Visualization
SimLipid provides a comprehensive project management, associating lipid analysis results with input profiles and search parameters. You can create any number of projects. You can also import hundreds of raw data files in batch mode. The complete raw data from an experimental MS run: total ion chromatogram, identified lipids, MS or MS/MS spectrum, and their corresponding database information are displayed in a single workbench.
SimLipid provide following additional features:
1. Average MS and MS/MS scans corresponding to a specified retention time window and/or a precursor m/z range.
2. Sort the loaded datasets on the basis of Precursor Ion m/z, Charge State, Retention Time, Intensity and Drift Time for the file formats supported.
3. The scans/spectrum for which lipids are identified are color coded with the name/abbreviation/molecular formula of the identified lipid displayed along side.
4. View extracted ion chromatogram of a target m/z.
High Throughput MS Lipid Search
SimLipid enables high throughput lipid profiling from multiple MS peak list data by searching lipid precursor ion against the known lipid structures available in the SimLipid database for Carnitines, Fatty acyls, Glycerolipids, Glycerophospholipids, Polyketides, Prenols, Saccharolipids, Sphingolipids and Sterols. Users can perform MS Lipid Search for high resolution data with an error tolerance less than or equal to 50 ppm or 2000 milliDalton (mDa). SimLipid supports [M+H], [M+NH4], [M+Na], [M+C5H12N], [M+Li] ions in the positive ion mode and [M-H], [M+AcO], [M+Cl], [M-CH3], [M+OAcO] and [M+HCOO] in the negative ion mode. Users can also trigger product ion data analysis from an MS lipid profile. The profiled lipids corresponding to a precursor m/z can be verified using product ion data for candidate lipid species.
Users can import the ion species for precursor m/z values that have been included in a high throughput search, from a predefined list of m/z values and corresponding ion species. This facilitates MS/MS search in variable ion modes and for different adducts. Multiple options are available for selecting MS and MS/MS profiles to be included in a batch run based on retention time, precursor m/z and intensity.
High Throughput Lipid Structural Elucidation using MS/MS and MSE Data
SimLipid supports structural elucidation of lipids using precursor and product ion m/z data from MS/MS and MSE spectra of Carnitines, Fatty acyls, Glycerolipids, Glycerophospholipids, Prenols, Saccharolipids, Sphingolipids and Sterols. Identified lipids are scored based on an innovative ranking algorithm that indicates the relative degree of proximity of theoretical lipids with the experimental data. High resolution accurate mass data with error tolerance between 0.001-50 parts per million (ppm) and 0.1 to 2,000 milliDaltons (mDa) can be analyzed.
Multiplexed Precursor Ion Scan (PIS) and Neutral Loss Scan (NLS) Triple Quadrupole Mass Spectrometry Methods Based Lipid Profiling and Quantitation
Data from multiple PIS/NLS can be imported into SimLipid software using either native file formats or standard formats. Users can model experimental designs in SimLipid by classifying data files according to biological/technical replicates. Identification of lipids based on target fatty acyls/head group fragment ions or their neutral losses is processed in batch mode.
SimLipid enables quantifying lipids corresponding to the peaks observed on the MS spectra. Quantification is done by normalizing the intensity values based on the observed intensity of a chosen internal standard. The program facilitates specification of endogenous/exogenous lipids as internal standards. To enable quantification of lipids from low resolution spectra, SimLipid corrects the intensities for isotopic overlaps. This facilitates accurate quantification of lipids from biological mixtures. The quantified data along with other information such as peak m/z, molecular formula, corrected, uncorrected and normalized intensities in different samples can be exported to a spreadsheet compatible .csv and .xls formats.
LC MS and LC- MS/ MS High Throughput Data Processing
SimLipid processes the LC-MS and MS/MS data for peak detection, smoothing, chromatogram deconvolution, peak deisotoping, and molecular feature finding. The program aligns detected peak m/z values to corresponding MS/MS spectra enabling seamless identification of lipid structures using precursors and product ions data from MS and MS/MS data.
SimLipid also facilitates comparative and quantitative analysis of lipids identified from different biological samples. The peaks detected from different peaklists are aligned based on the agreement of retention time, m/z value, observed intensity and charge state using the RANSAC techniques. Up to 200 peaklists can be aligned and the results can be exported to HTML, CSV and MS Excel formats.
SimLipid software provides a single workbench view of the LC-MS peaklist; list of identified lipids in the experimental LC-MS run; Structure of the identified lipid at a particular retention time; associated information of the identified lipid in the database; and total ion chromatogram with a vertical bar at the retention time of the identified lipid.
Mass Spectra Annotation with Identified Lipids
SimLipid annotates mass spectra with the lipids, and fragment ions identified for MS, MS/MS as well as MSE data. This helps in interpreting mass spectra by highlighting the experimental m/z values that match those of theoretical lipid structures from the product database.
The annotated mass spectra can be adjudged/re-sized either to fit on a page or based on the area of interest. A user can zoom in/out into a specific plot location using the mouse cursor or by specifying the m/z range. Further, users can export the annotated spectra as images (in PNG and JPEG formats) that can be included in MS PowerPoint, facilitating information sharing amongst research groups.
Generate Report
After analyzing mass spectrometric data, users can generate goal-oriented reports in HTML, csv and MS Excel formats from 50,000 MS and MS/MS profiles. Users can set SimLipid to launch the report automatically after performing the analysis. The reports that can be generated are for:
-
Profiled MS Spectra: A comparative analysis of the abundance of profiled lipids present in different biological samples can be generated for biomarker studies.
-
MS and MS/MS Data: The report displays the false positives corresponding to a precursor m/z value that are usually encountered in an MS search and the probabilistic score of lipids identified during a product ion data analysis. Such a report is generated by combining an MS lipid profile and its complementary MS/MS or MSE lipid profiles.
-
Multiple Data Sets: A report containing a comparative analysis of the lipids profiled from different MS or MS/MS spectra acquired in different ion modes and adducts.
-
Retention Time: This report enables users to investigate the fragment ions observed in MS/MS spectra acquired in variable ion modes by aligning the MS/MS profiles based on retention time. This provides a complete work flow solution to identify the structure of unknown lipids that belong to categories such as GP, SP, GL etc. where diagnostic ions corresponding to fatty acid chains are observed in negative spectra while those corresponding to head group are observed in positive ion spectra.
Database Search
You can also search for a lipid structure of interest by lipid abbreviation/common name, mass, chemical composition or lipid ID.
- 2026-02-09
- 2026-01-20
- 2026-01-16
- 2026-01-12
- 2026-01-12
- 2026-01-09
- 2026-02-05
- 2026-02-05
- 2026-01-28
- 2026-01-26
- 2026-01-26
- 2026-01-16


